Election Day 2026 is over, but the work for researchers, election officials, and practitioners is continuing as results get certified, processes get audited, and trends about voter experience get analyzed. This page will feature data analysis from key states, races, and trends from 2026, including vote share over time, vote mode, and more.
Vote Share Over Time
Maine
Date created: November 4, 2026
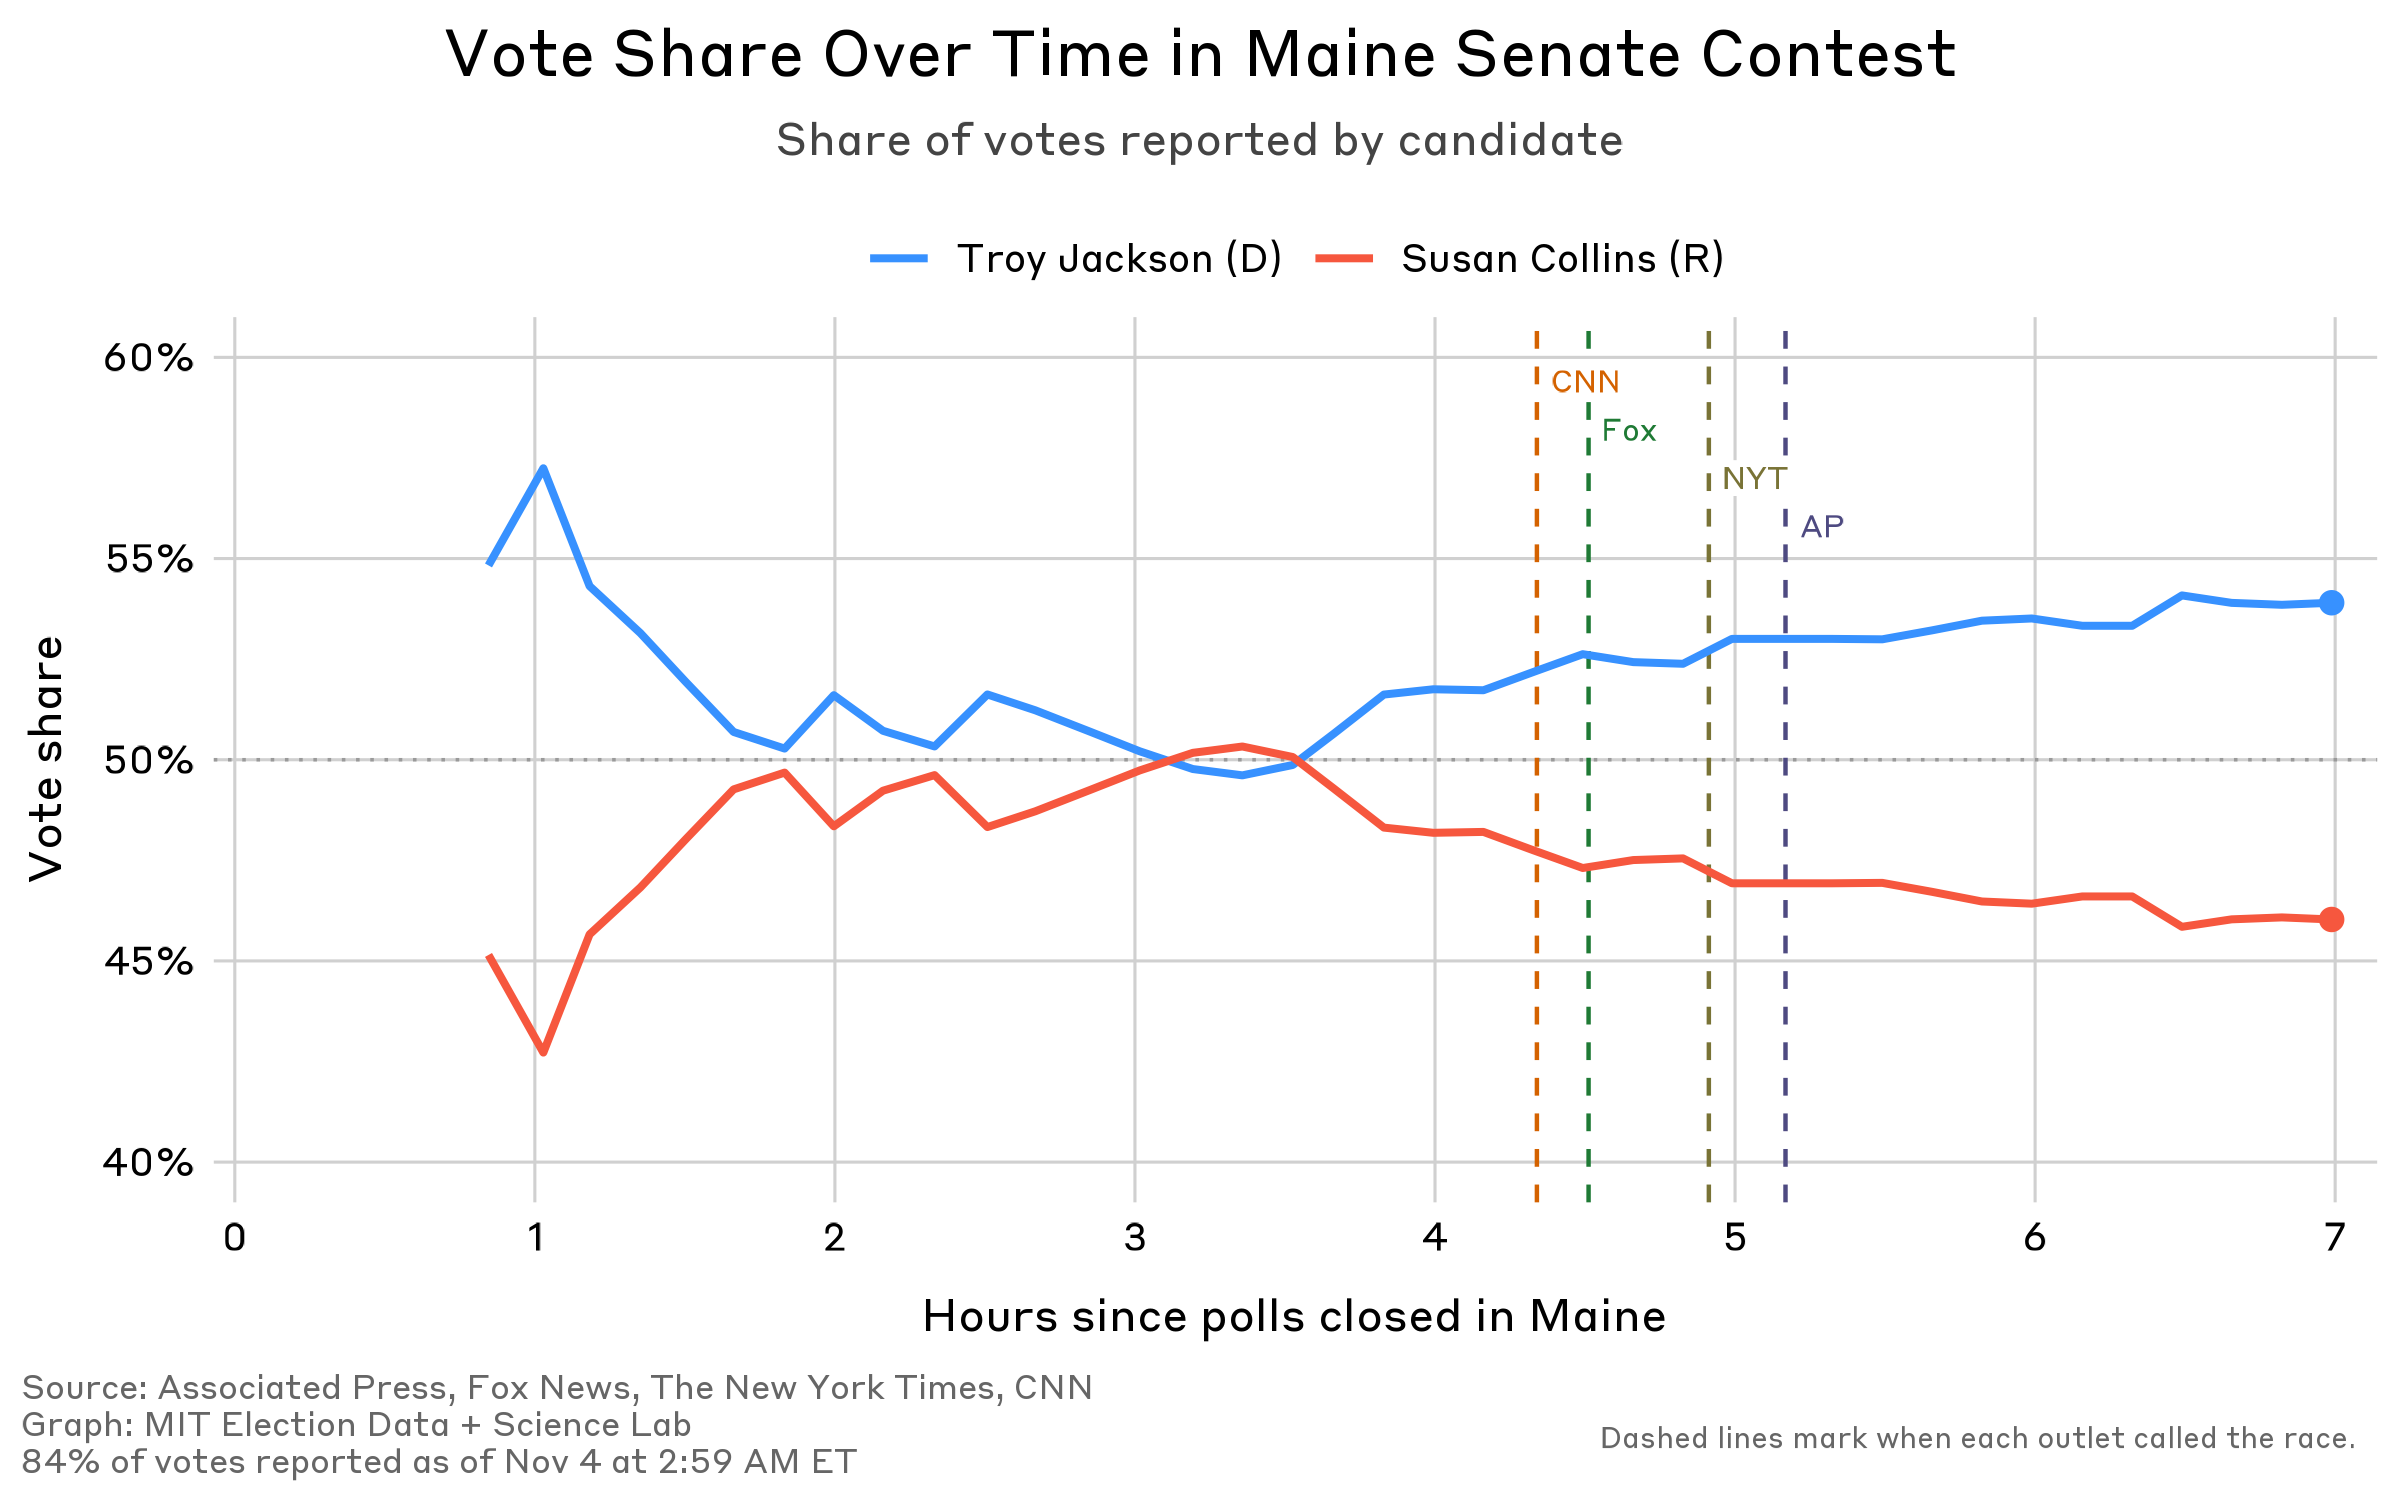
This line chart shows the vote share over time for the 2026 U.S. Senate contest in Maine. The x-axis is the hours since the polls closed in Maine, and the y-axis is the vote share. The graph shows the first seven hours of vote reporting for this contest, ending at about 3:00 AM ET. Democrat Troy Jackson’s vote share is depicted by the blue line and Republican Susan Collins’ is shown by the red line. Vertical lines were included to show when four of the major news networks (CNN, The New York Times, Fox News, and the Associated Press) called the election in favor of Jackson. For most of the reporting period leading up to the networks calling the race, Jackson’s vote share remained above Collins’. CNN and Fox called the race about 4.5 hours (close to 12:30 AM ET) after the polls closed in Maine, while the New York Times and the Associated Press waited close to 5 hours (about 1 AM ET).
Michigan
Date created: November 4, 2026
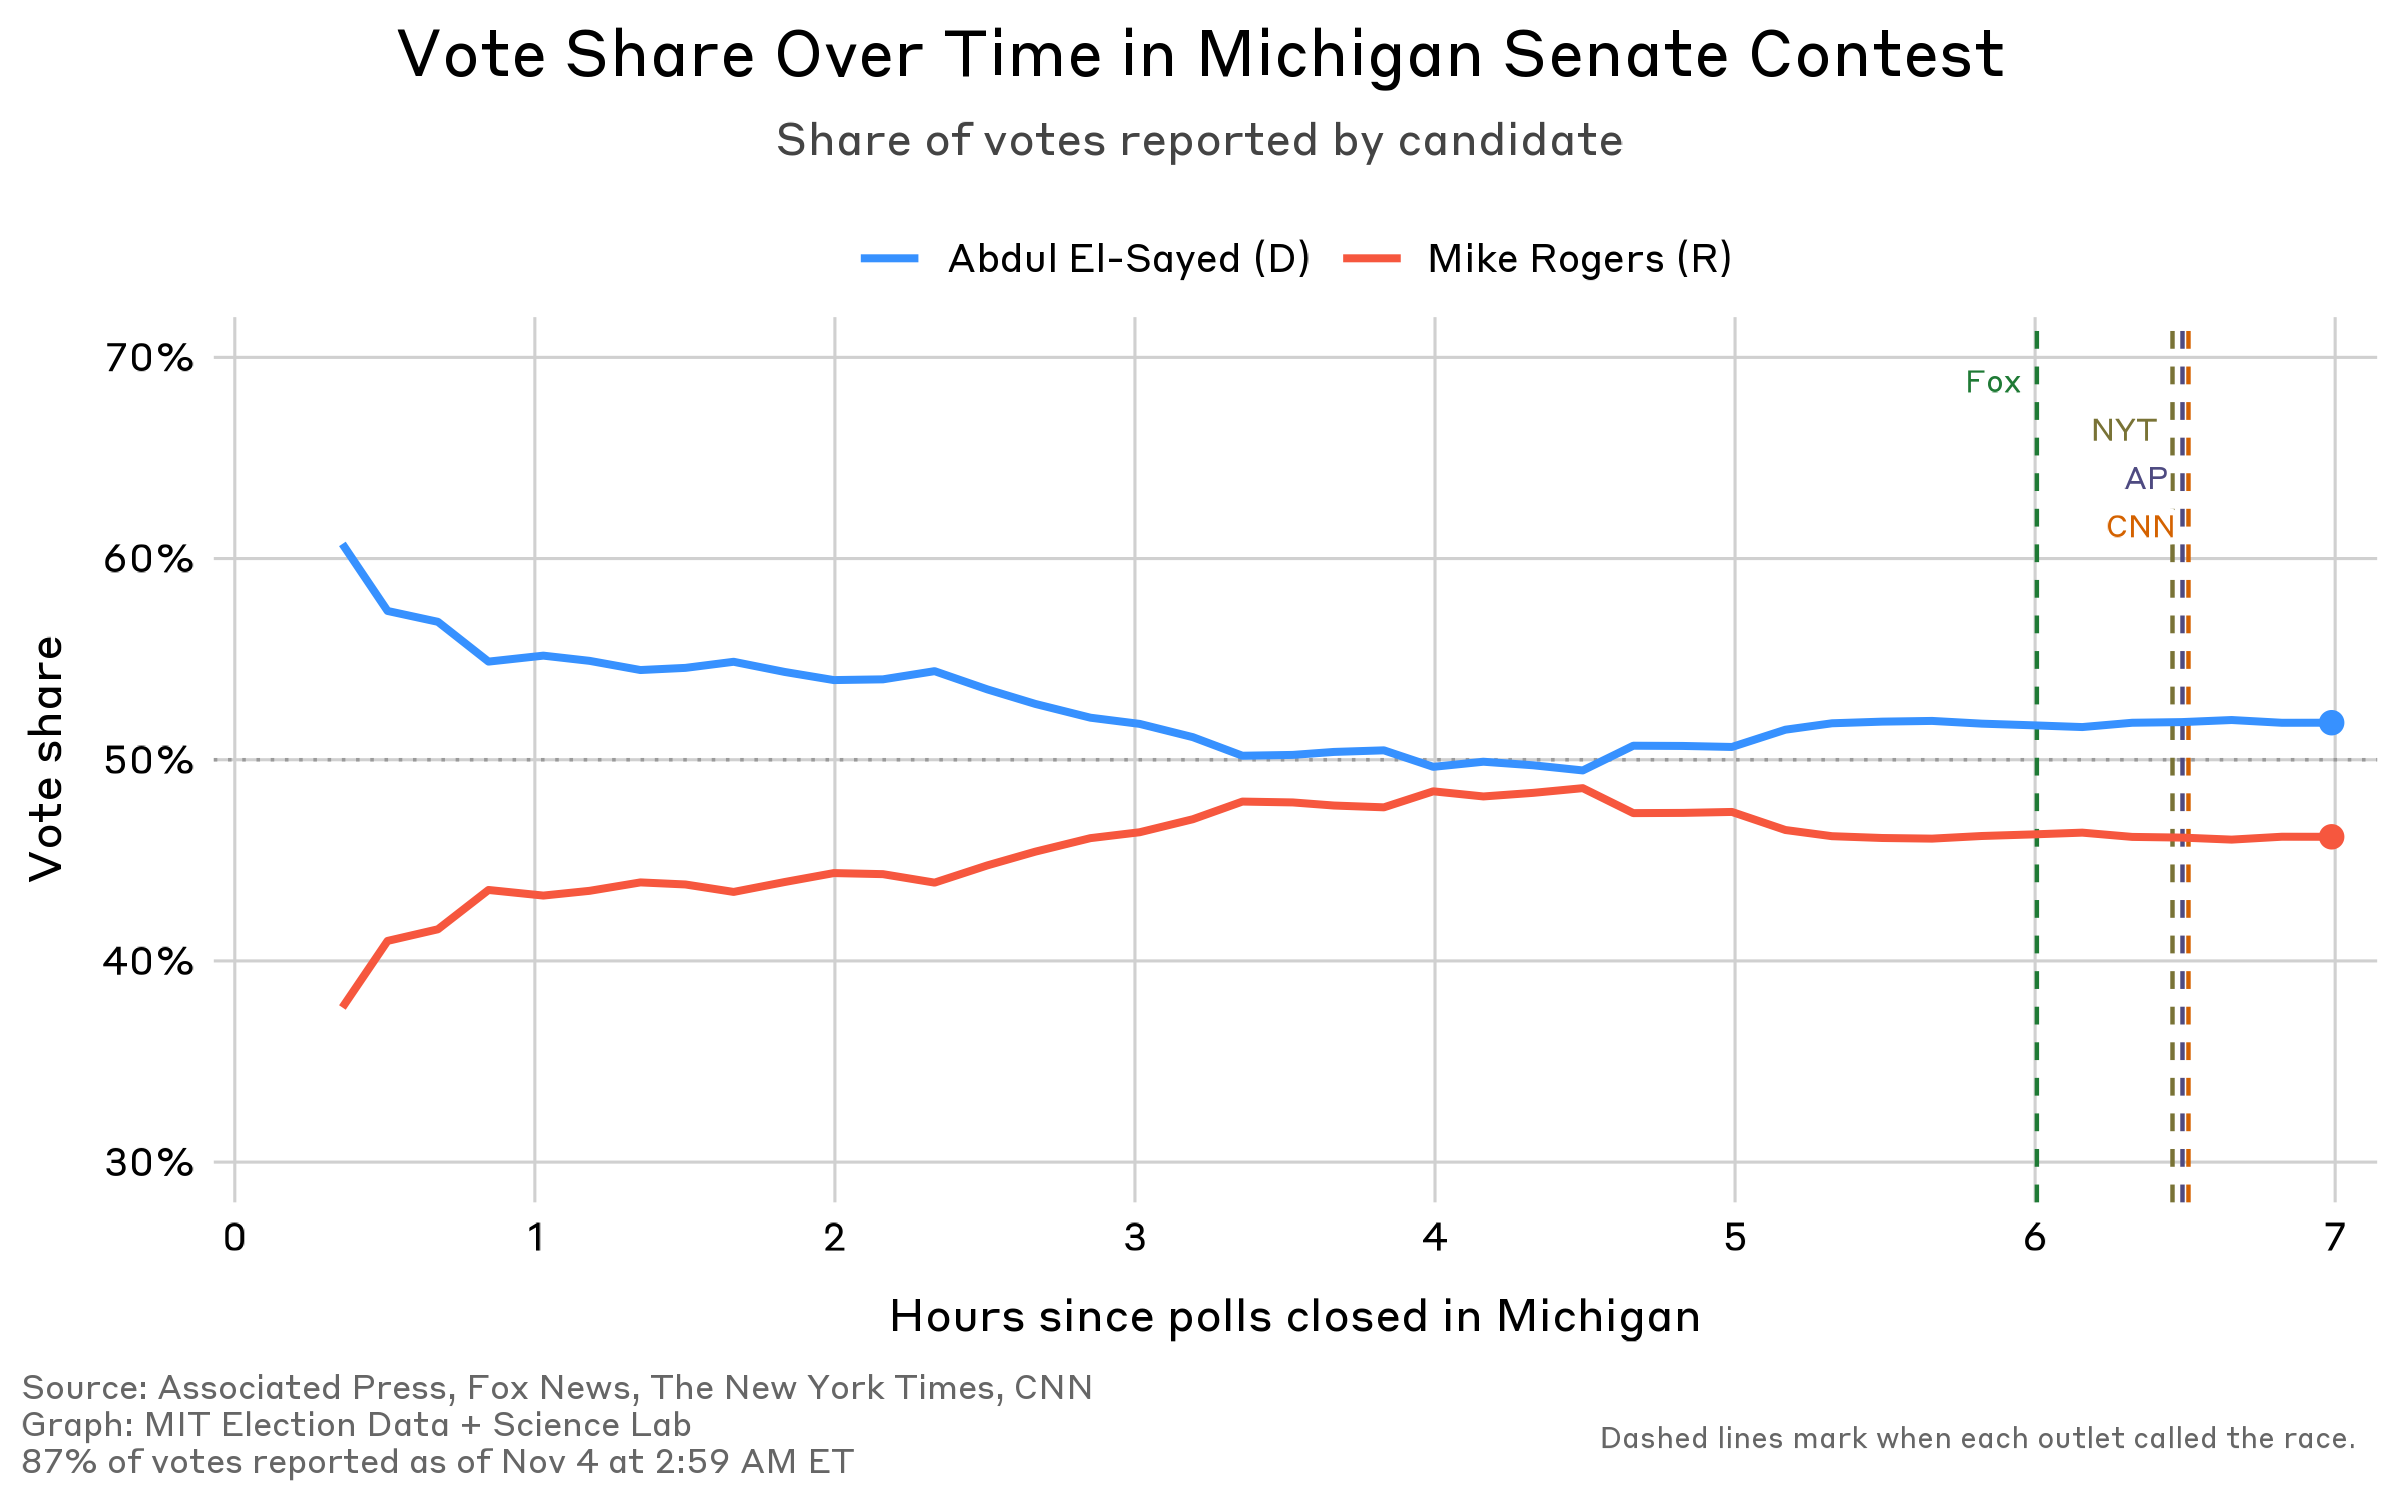
This line chart shows the vote share over time for the 2026 U.S. Senate contest in Michigan. The x-axis is the hours since the polls closed in Michigan, and the y-axis is the vote share. The graph shows the first seven hours of vote reporting for this contest, ending at about 3:00 AM ET. Democrat Abdul El-Sayed’s vote share is depicted by the blue line and Republican Mike Rogers’ is shown by the red line. Vertical lines were included to show when four of the major news networks (CNN, The New York Times, Fox News, and the Associated Press) called the election in favor of El-Sayed. El-Sayed’s vote share remained above Rogers’ as votes were reported, and Fox was the first outlet in this group to call the race at about 2 AM ET.
Minnesota
Date created: November 5, 2026
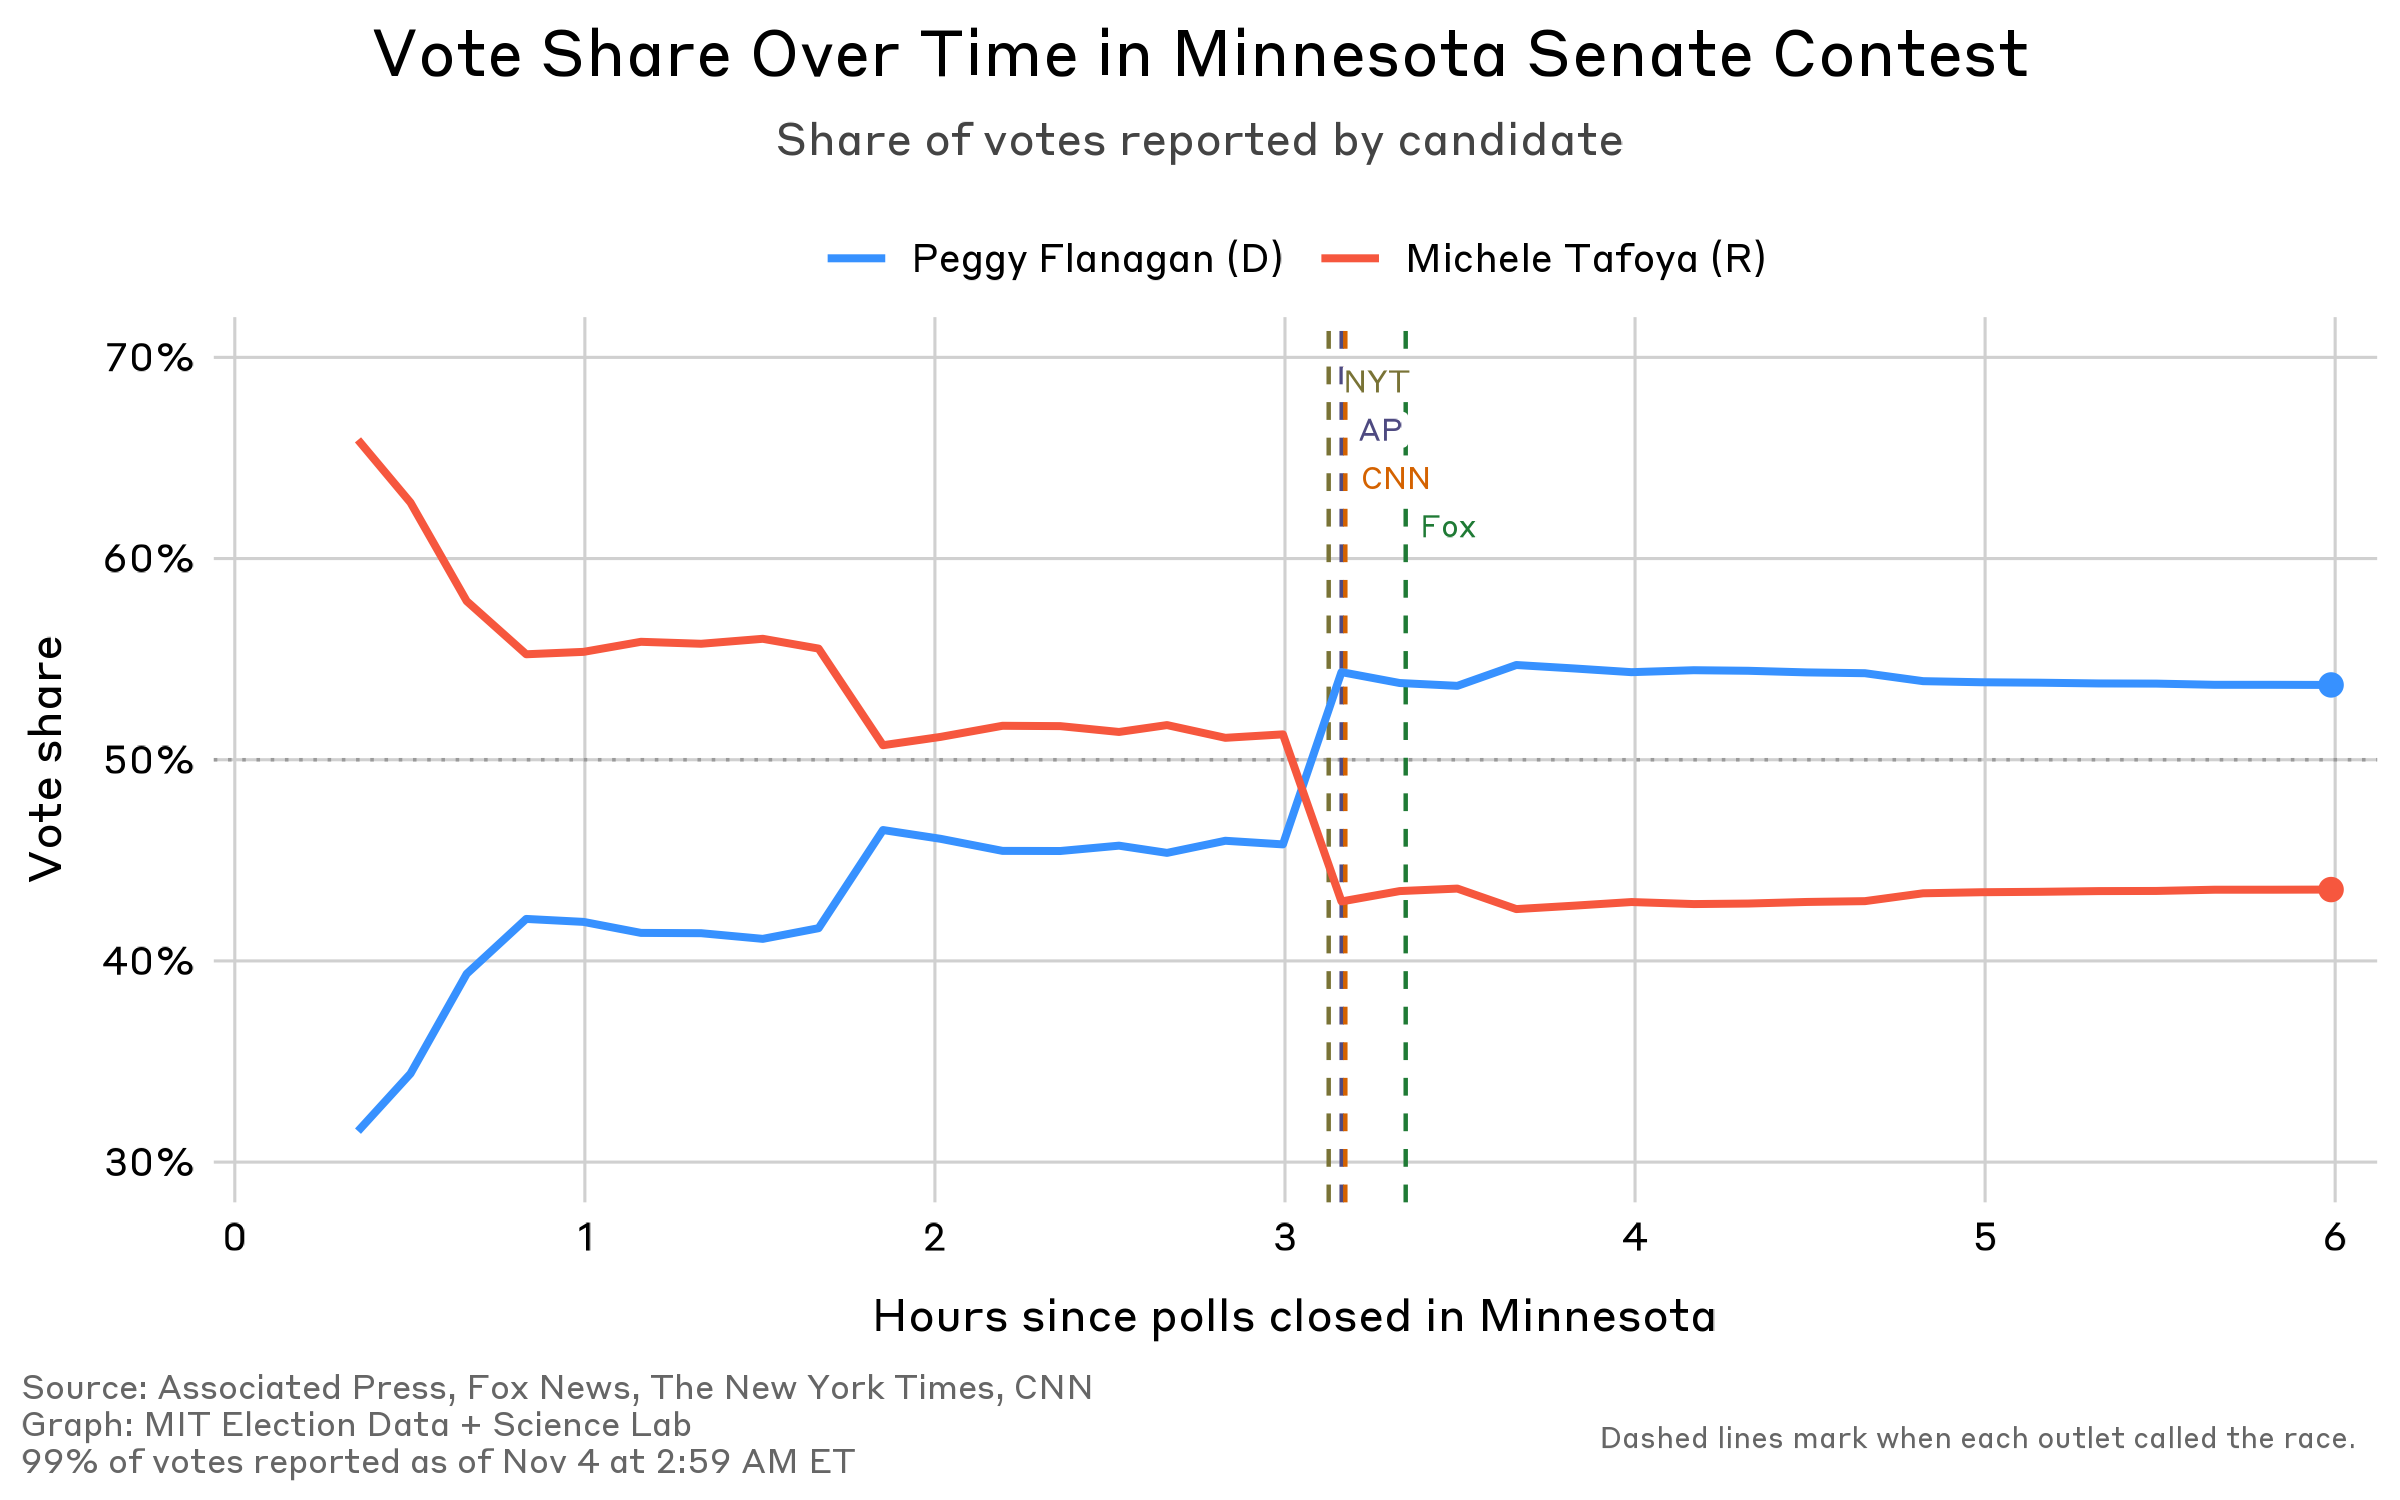
This line chart shows the vote share over time for the 2026 U.S. Senate contest in Minnesota. The x-axis is the hours since the polls closed in Minnesota, and the y-axis is the vote share. The graph shows the first six hours of vote reporting for this contest, ending at about 3:00 AM ET. Democrat Peggy Flanagan’s vote share is depicted by the blue line and Republican Michele Tafoya’s is shown by the red line. Vertical lines were included to show when four of the major news networks (CNN, The New York Times, Fox News, and the Associated Press) called the election in favor of Flanagan. During the first three hours after the polls closed in Minnesota, Tafoya was in the lead. As more votes started to be reported, the momentum shifted in Flanagan’s favor, and the race was called for Flanagan just three hours after the Minnesota polls closed.
Texas
Date created: November 4, 2026
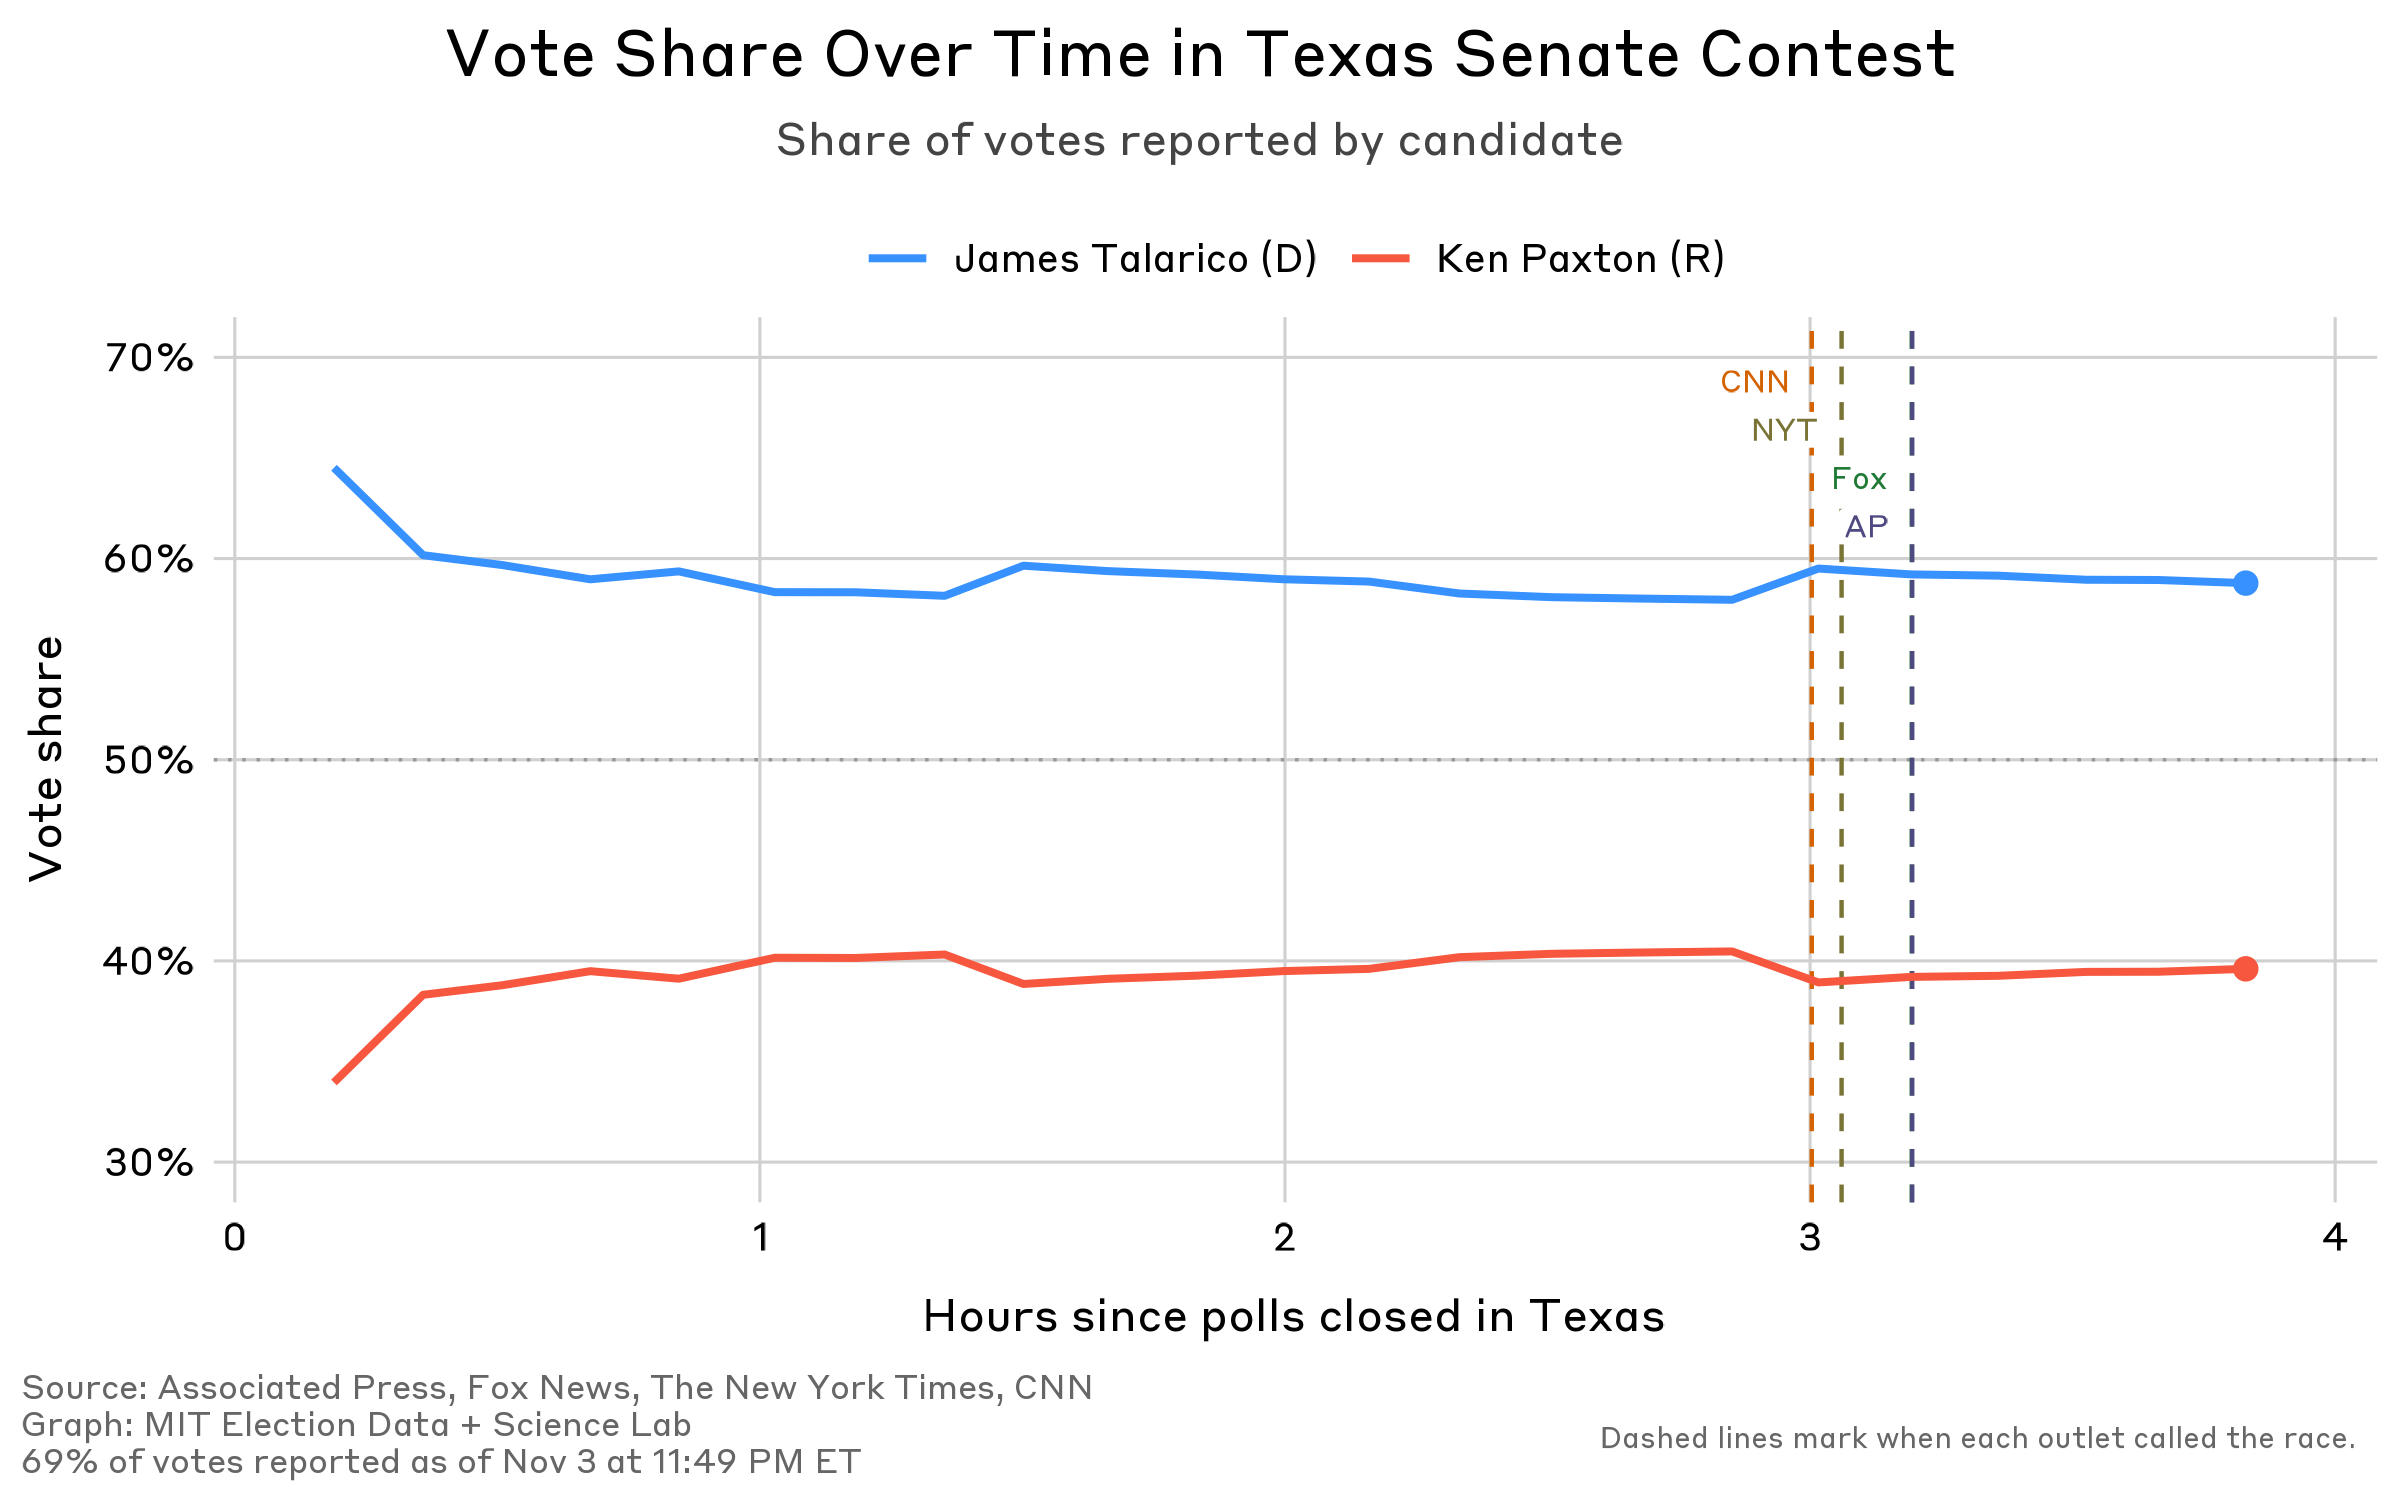
This line chart shows the vote share over time for the 2026 U.S. Senate contest in Texas. The x-axis is the hours since the polls closed in Texas, and the y-axis is the vote share. The graph shows the first four hours of vote reporting for this contest, ending at about 12:00 AM ET. Democrat James Talarico’s vote share is depicted by the blue line and Republican Ken Paxton’s is shown by the red line. Vertical lines were included to show when four of the major news networks (CNN, The New York Times, Fox News, and the Associated Press) called the election in favor of Talarico. Talarico held about 60% of the vote share during the first four hours of reporting after the Texas polls closed, and the race was called for him by all outlets around three hours after votes started to be reported.