Key State
Last updated: Aug 07, 2026
Georgia
Current Memos
As one of the country's most closely watched battleground states—and one of only a few that conducts general election runoff elections—Georgia's election system and the officials who administer it are likely to face national attention and scrutiny throughout the election cycle. In this report, we discuss recent policy and law changes and the primary election, while highlighting the role that election administration will play this fall.
Memo
/ July 16, 2026
Georgia provides statewide election data dating back to 2004, including voter registration records and statistics, voter history files, absentee voter files, early in-person voting statistics, and election results. Generally, the most recent versions of these datasets are available on the Georgia Secretary of State's Elections Division webpage. In this document, we identify the data locations and their dedicated webpages.
Memo
/ July 14, 2026
State Resources
Archive: Previous Election Memos
Polls in Georgia close at 7 p.m., and results will likely follow not long after. However, just a fraction of the vote will be cast today—all told, over four million ballots were cast and accepted in this pivotal state before Election Day. For comparison, that is around 81% of total votes cast in Georgia’s 2020 election. There is a great deal of administrative data about these ballots, particularly since the Peach State provides demographic data, which we use to analyze the composition of the electorate across Georgia as a whole and in a few notable counties. In this post we examine the demographics of mail and early voters by merging Georgia’s absentee ballot file as of today with a snapshot of the Georgia voter file.
Memo
/ November 05, 2024
As in 2020 and 2022, Georgia is expected to be a critical battleground this November. While there are no marquee Senate contests on the ballot this year, the state’s 16 electoral votes have the potential to decide who wins the presidency in what was the closest state of the 2020 election, decided by just 0.23 percent—or 11,779 votes.
Four years later, Georgia’s elections are particularly steeped in controversy, and concerns about election integrity, voter suppression, and the autonomy and safety of poll workers continue to dog the election process. Two dozen new election laws have been enacted, changing how elections are conducted in Georgia. These two contests gave us insights into—and data on—the inner workings of Georgia’s 2024 election process, and serve as a useful guide to the November election.
Memo
/ July 10, 2024
Archive: Previous Data Visualizations
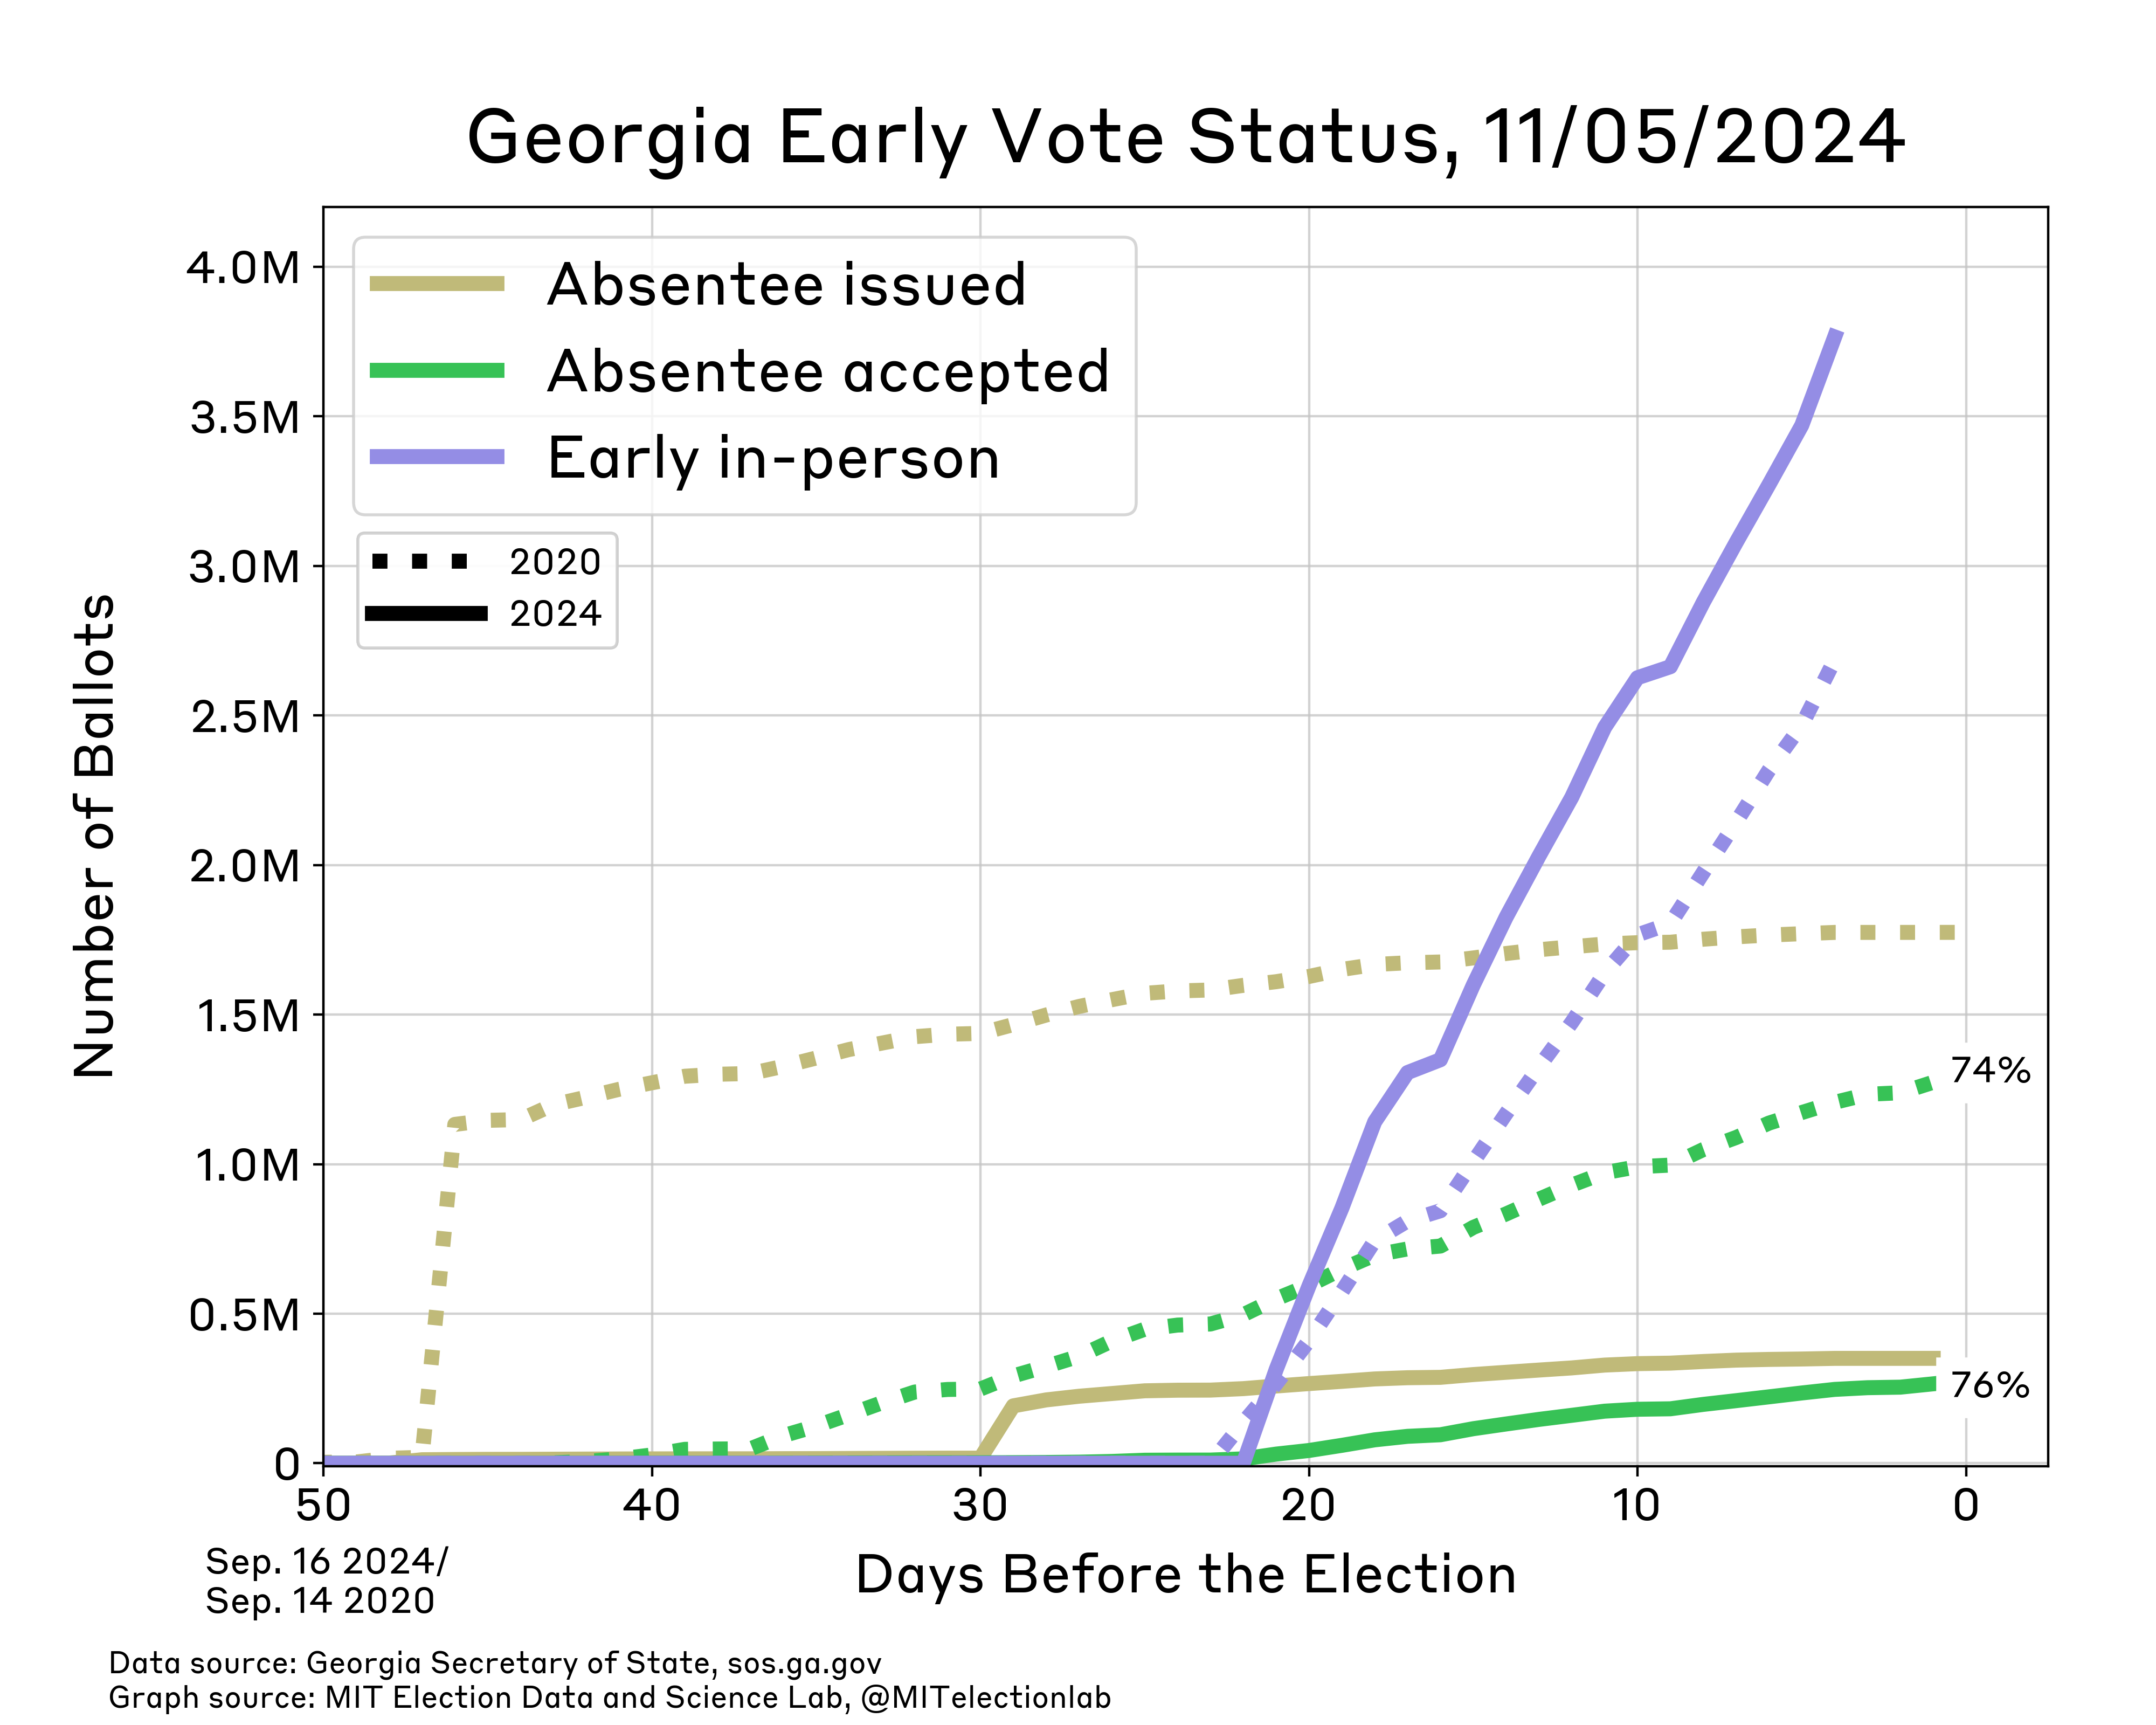
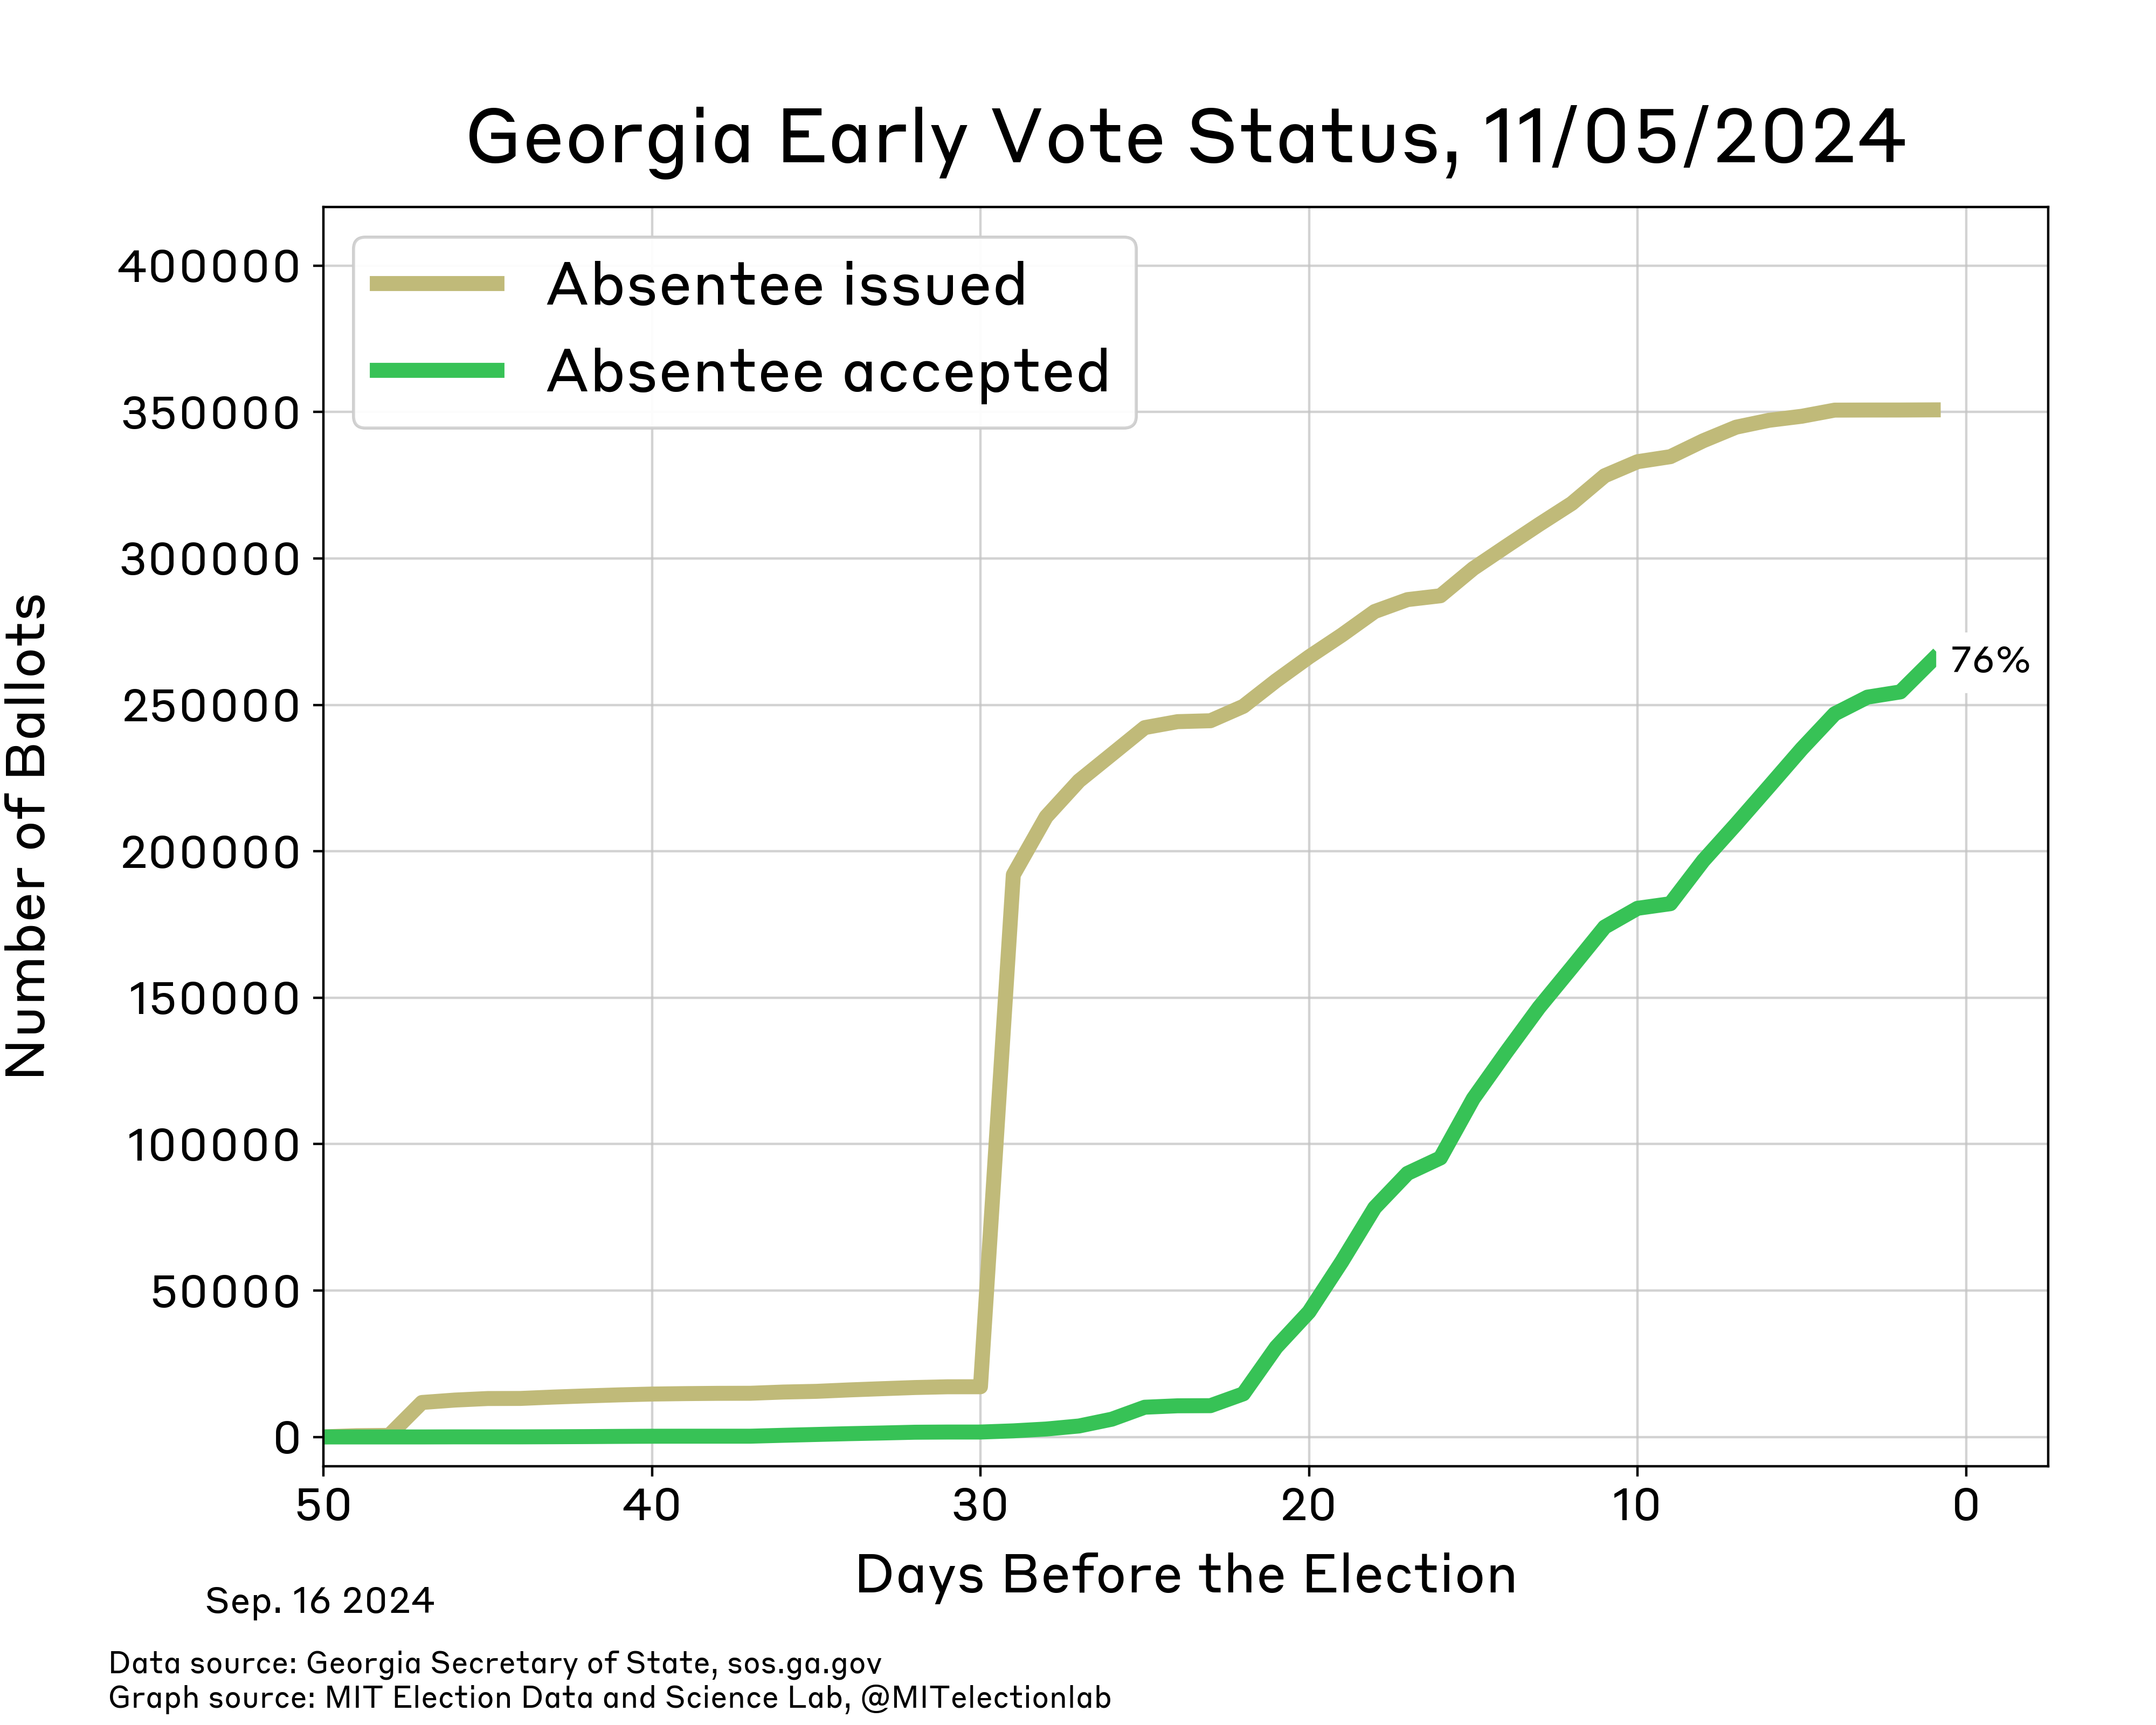
Mail Ballot Visualizations
Last updated November 5, 2024
2024 and 2020 Comparison
2024 Early Voting Only:
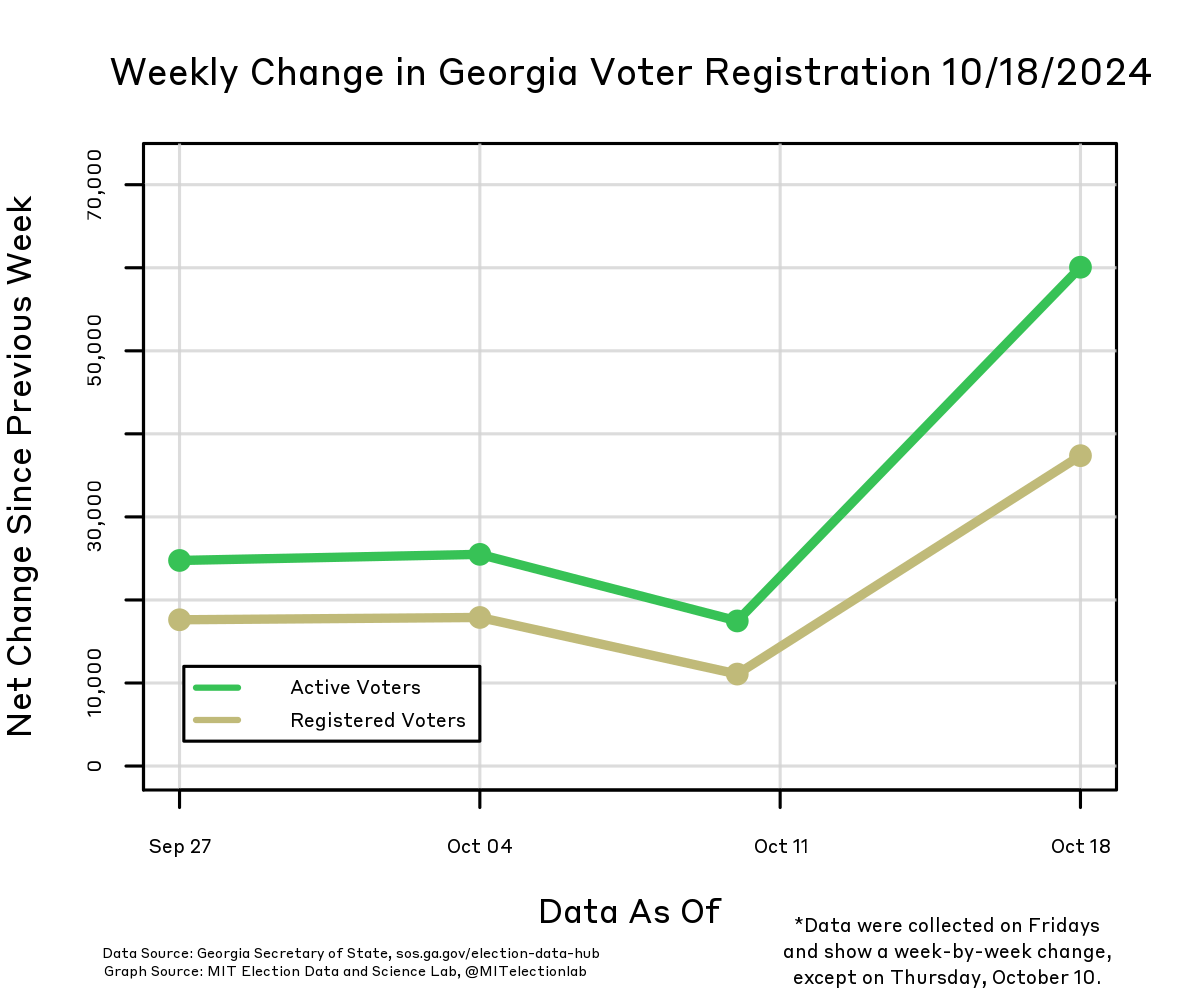
Voter Registration
Last updated October 18, 2024