Last updated: Jun 12, 2026

Texas

Current Memos

There are no current memos to display.


State Resources

Texas Secretary of State

Archive: Previous Election Memos

In Texas, election administration functions in a seemingly constant back-and-forth between urban election offices, state officials, and the state judiciary. Local officials in the state’s largest counties — Harris, Dallas, Tarrant, Bexar, and Travis— have tested the limits of Republican state leaders through the expansion of progressive election policy, especially since the election of Donald Trump in 2016.

This report will explore the interactions between municipal and state administrators over the last four years, and what issues onlookers might expect to arise in the administration of the November 2024 election and its aftermath. Through an exploration of historical election data, election administration policy changes, and an evaluation of administration performance in recent elections, this report will address Texas’ election-related strengths and weaknesses as we inch closer to November.

Memo / August 01, 2024
Fill 1

Archive: Previous Data Visualizations

Mail Voting

Last updated November 4, 2024

20241104
The unofficial count of mail and in person early voters in Texas since September 29th 2024. The number of Texans who have returned their ballots by mail has risen gradually to over 350,000. Data for 2020 began on October 4th (30 days before the election) and was noticeably higher than at the equivalent point in 2024. Four days before the 2020 election, around 940,000 Texans had returned their mail-in ballot. Though in-person early votes are currently at around 8.6 million and had reached about 8.8 million in 2020, in person early began 22 days before the election in 2020 compared to 16 days before the election in 2024.

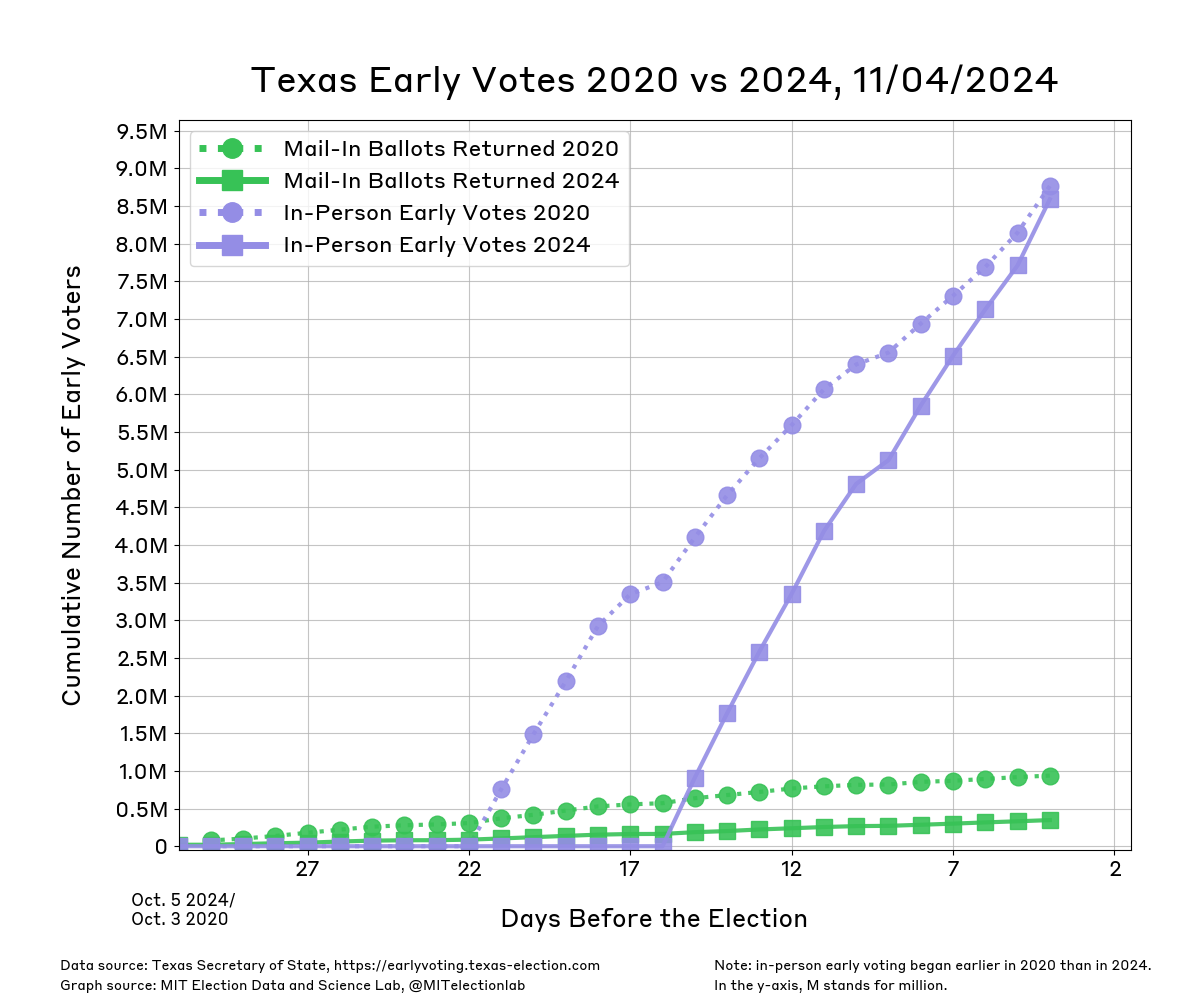
Note: Values may change over time as county election officials finish reporting the number of ballots received.
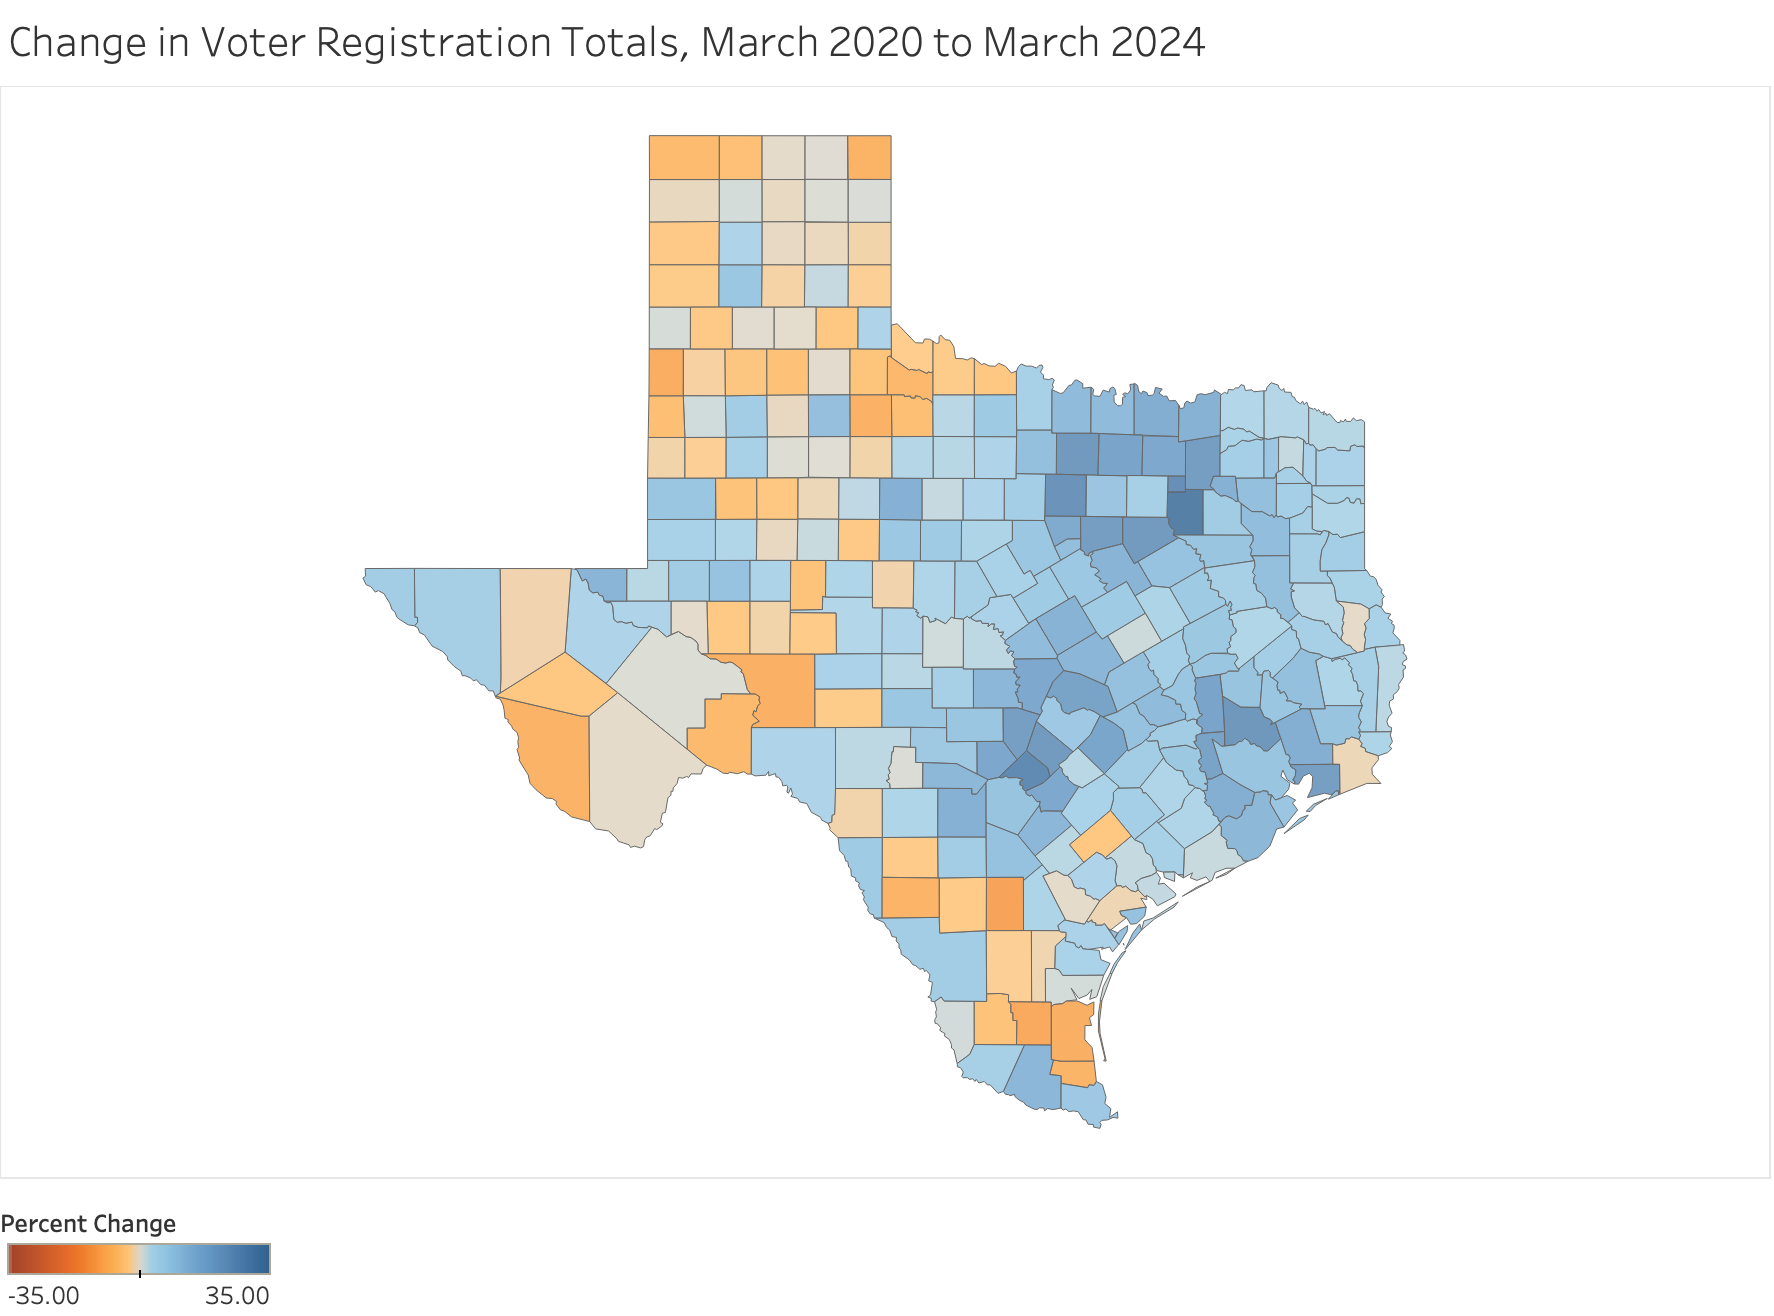
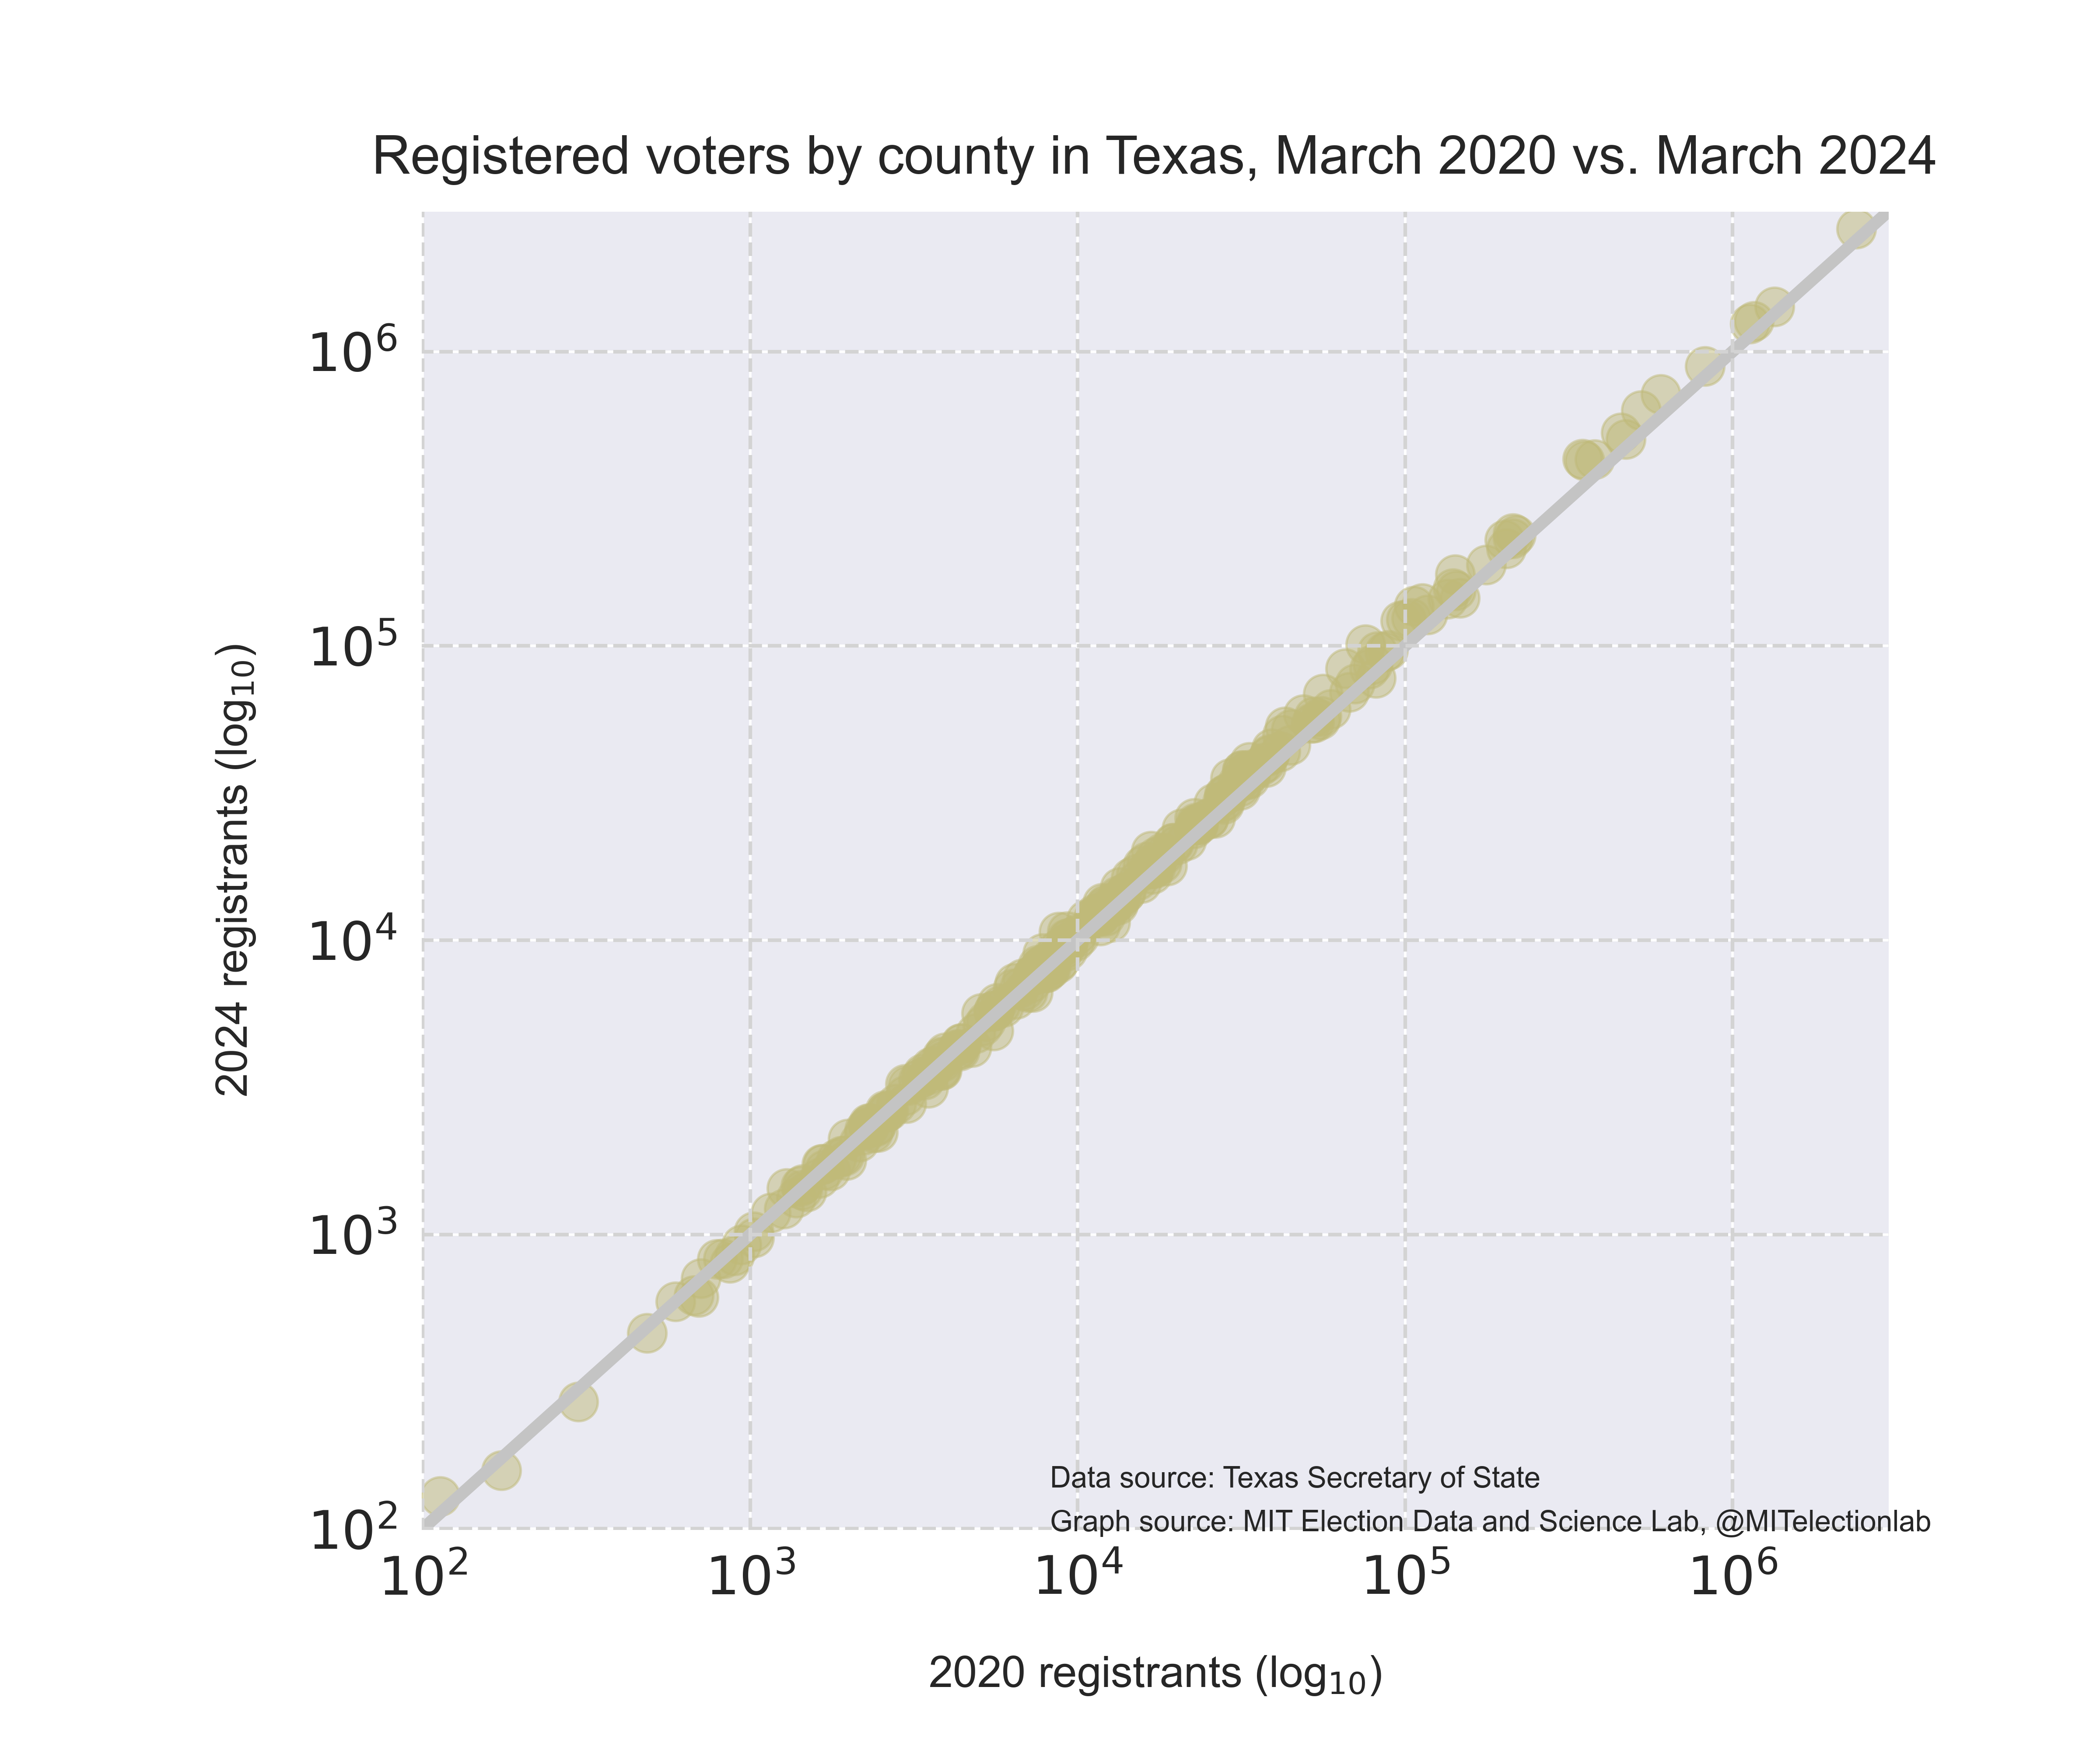
Voter Registration

Last updated October 2, 2024

tx_turnout_20_vs_24
This scatterplot compares the number of registered voters in each county in Texas in 2020 to the number registered in that county in 2024. All of the changes are clustered lie very close to a line where y=x, so that no county stands out as having a major population change. However counties with large populations tended to see slight increases, and counties with small populations tended to see slight decreases.

Texas County Map

Last updated October 2, 2024

TXreg_map
This map of Texas colours its counties by the amount that their population increased or decreased from the 2020 primary season to the 2024 primary season. Broadly, the Eastern half of the state, and particularly the large urban centers, have seen population increases, while populations have declined across the Western half of the state , especially northwest Texas and the panhandle.